This is what management reporting looks like when it’s built on SAP, not built around it.
The dashboards below run directly on SAP RE-FX and S/4HANA data, no parallel systems, no data warehouse rebuild, no months of setup before you see results. Rental income, vacancy, CAPEX/OPEX, and ESG connected and current. This is what your data already knows.

Rental income, occupancy & contracts — live from RE-FX
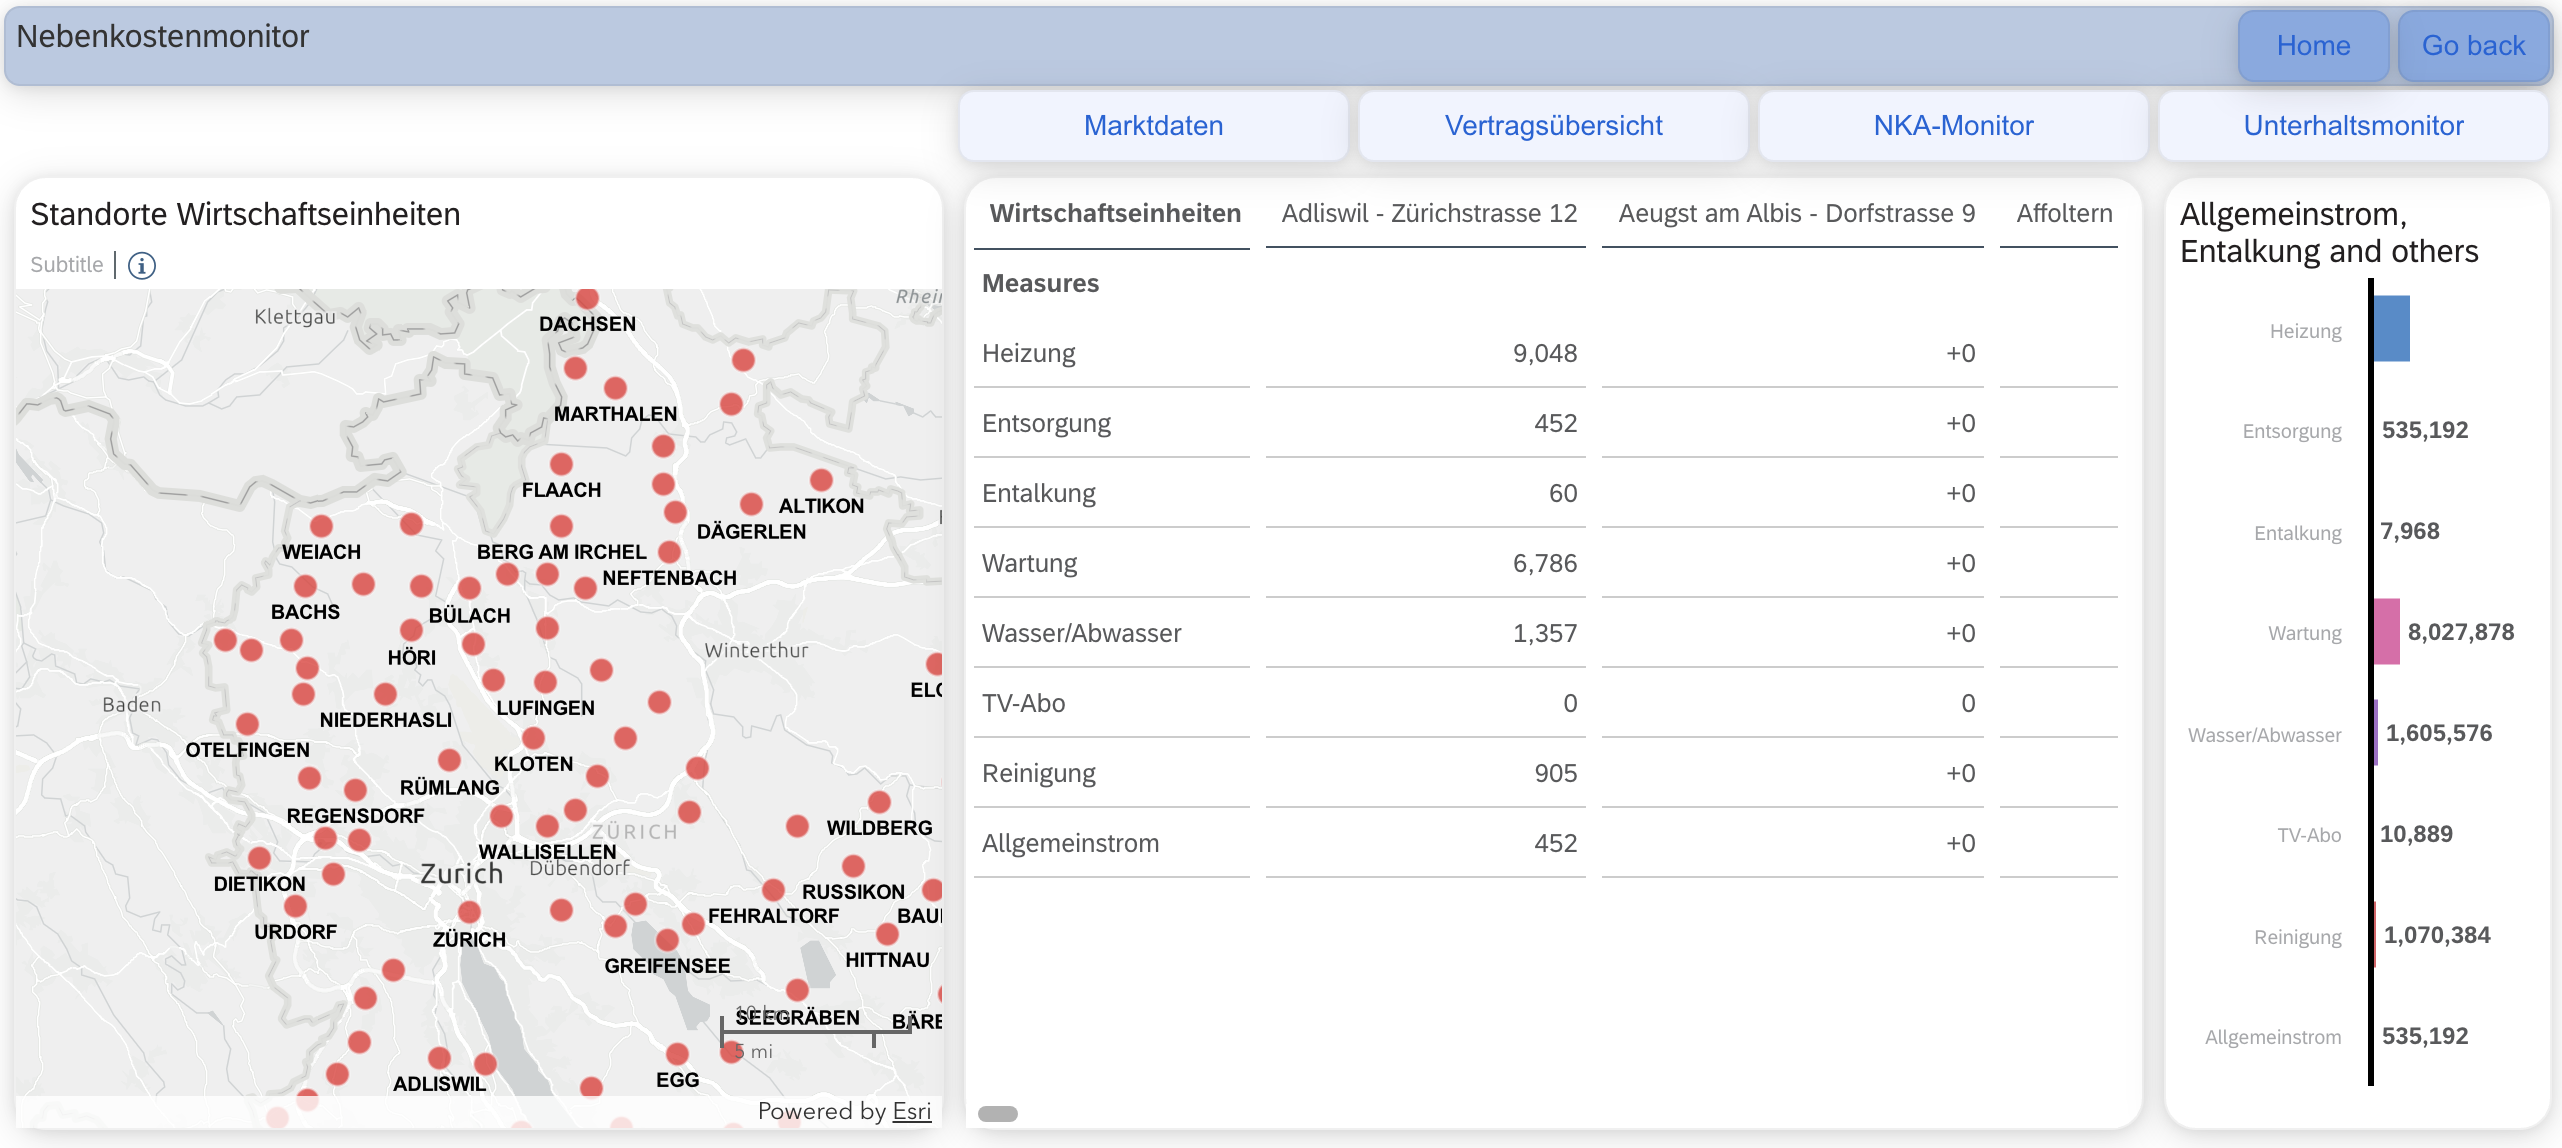
Nebenkosten Monitor
Every asset on the map — vacancy and income at a glance
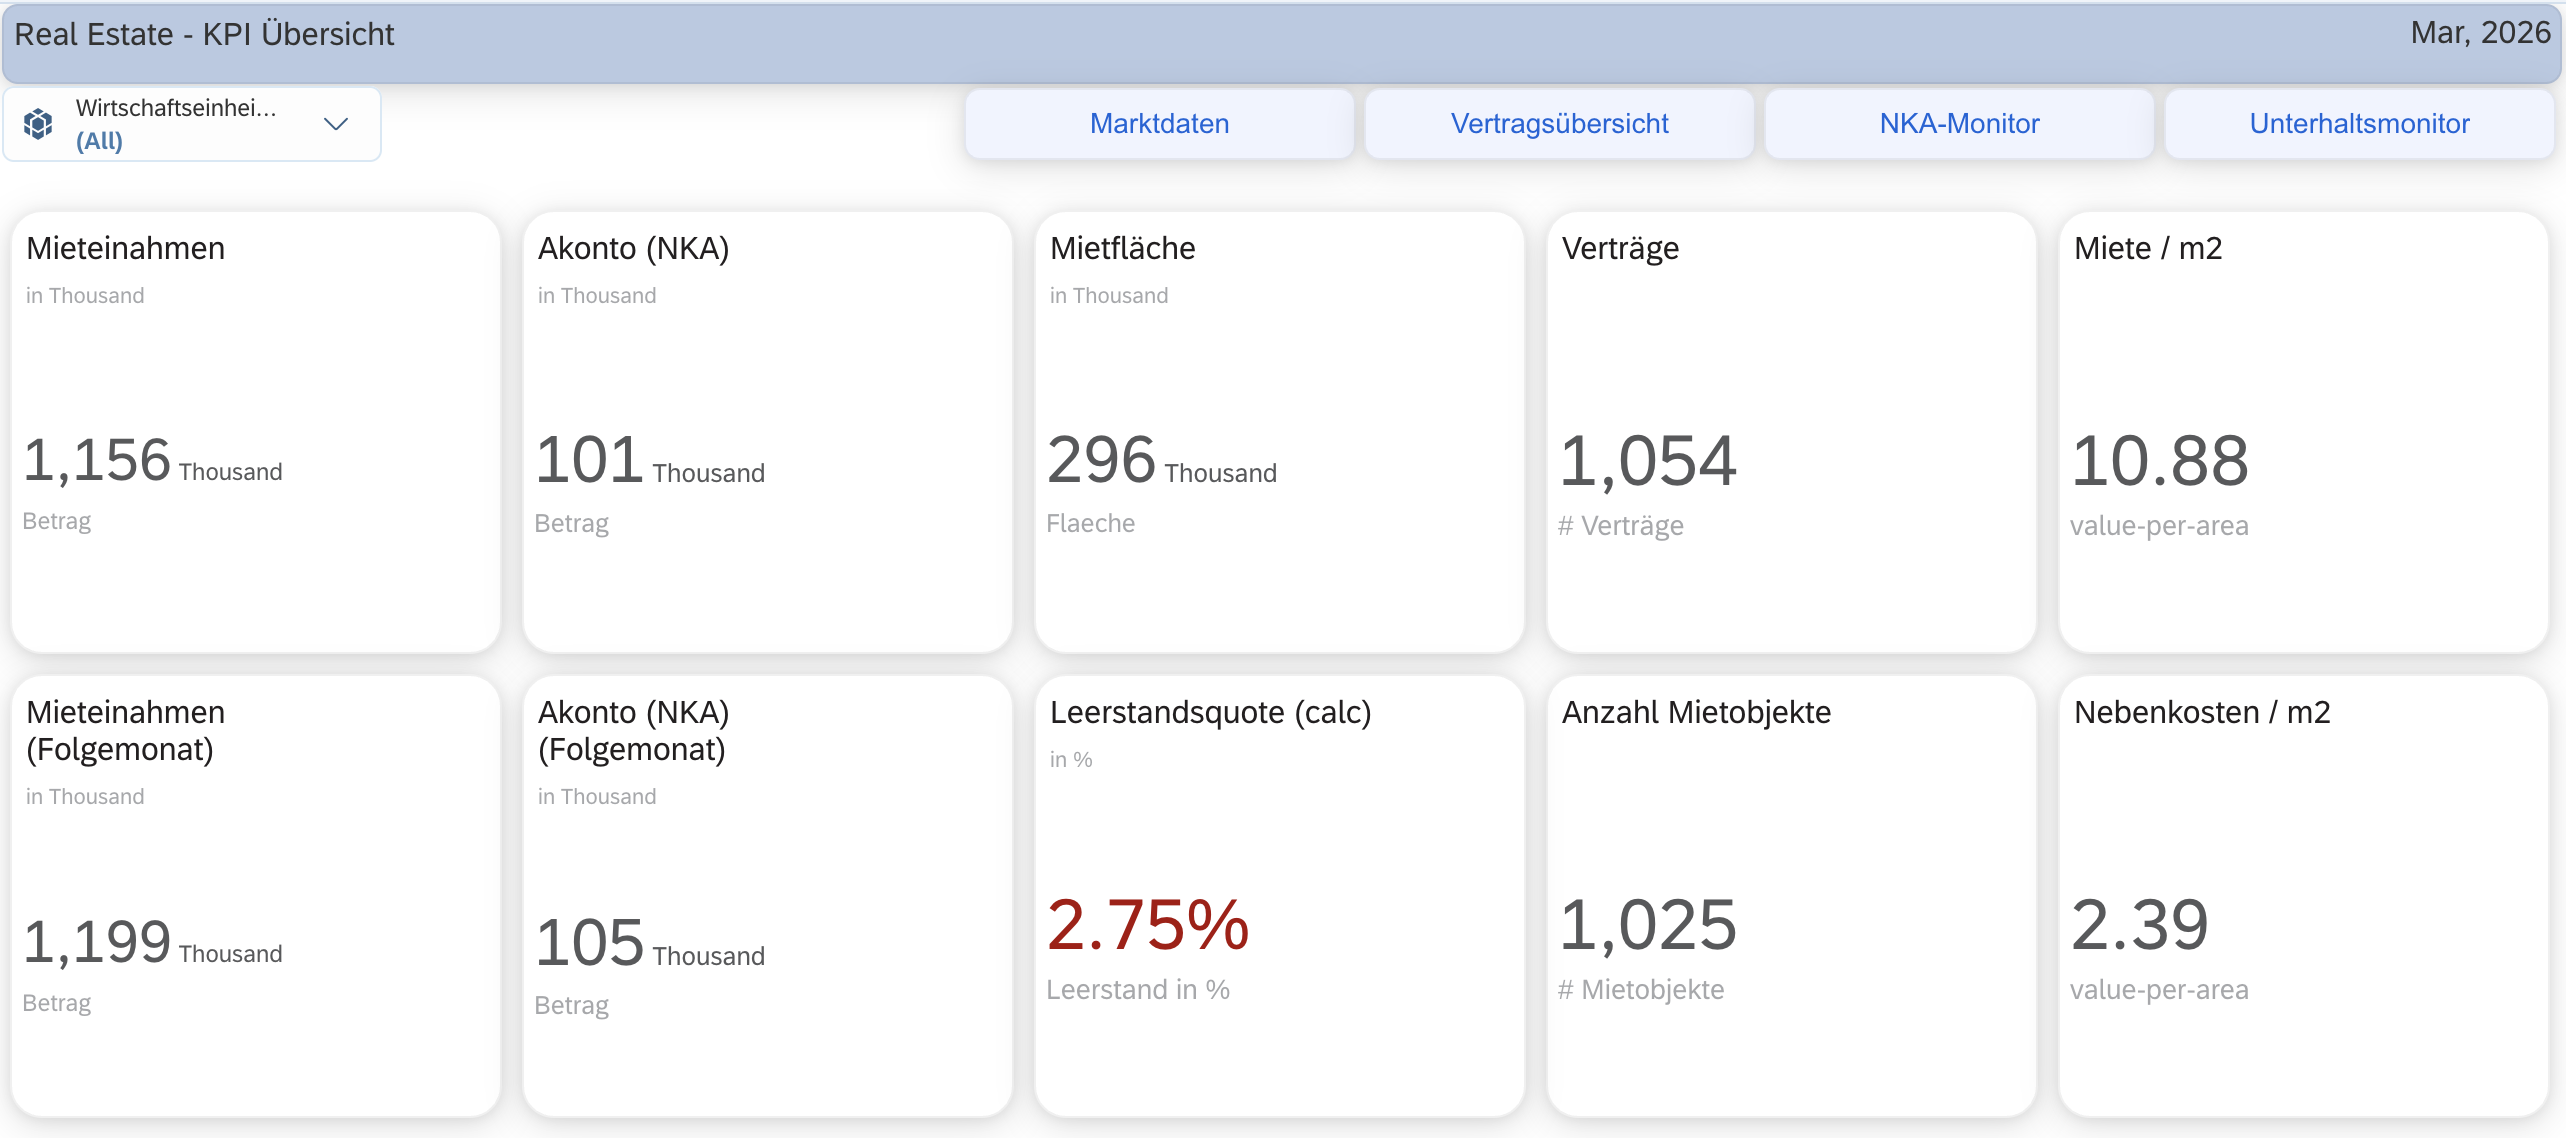
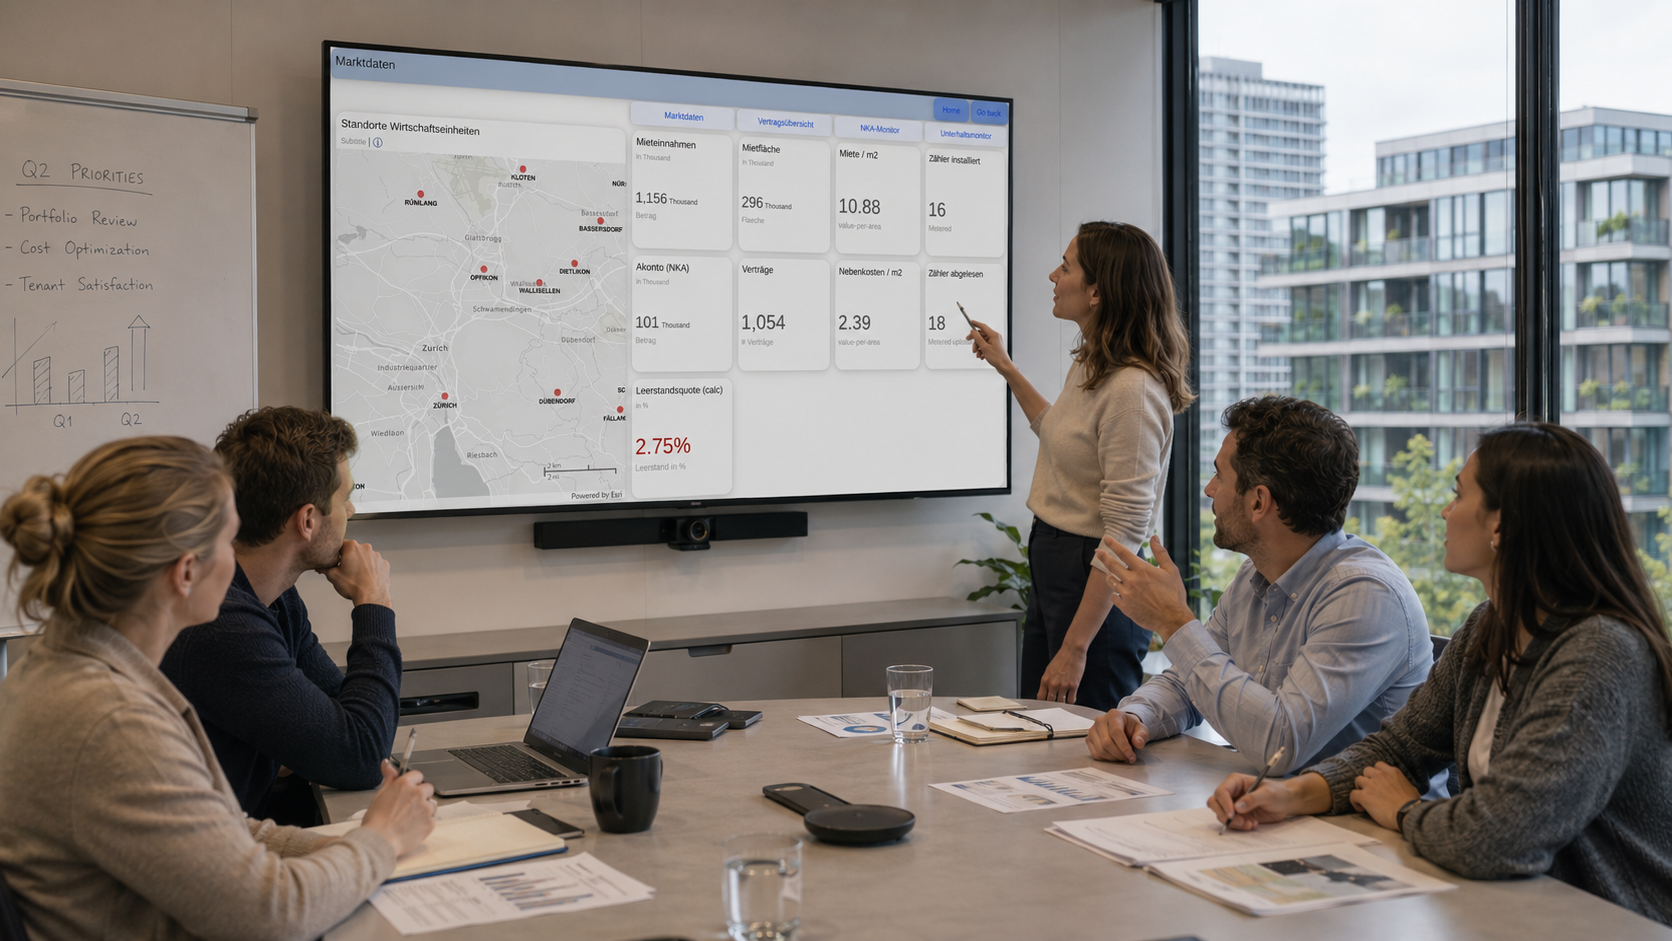
One view. Every number your board will ask for.
Rental income, vacancy rate, ancillary costs, and asset performance, all in a single management view connected directly to SAP RE-FX. No assembly required. This is the dashboard your CFO has been waiting for.
Know exactly what your portfolio earns and where it doesn’t.
Track rental income, occupancy, and contract status by asset, tenant, and region, pulled directly from RE-FX. Vacancy rates, income trends, and contract expiries visible without a single export. No waiting until month-end.
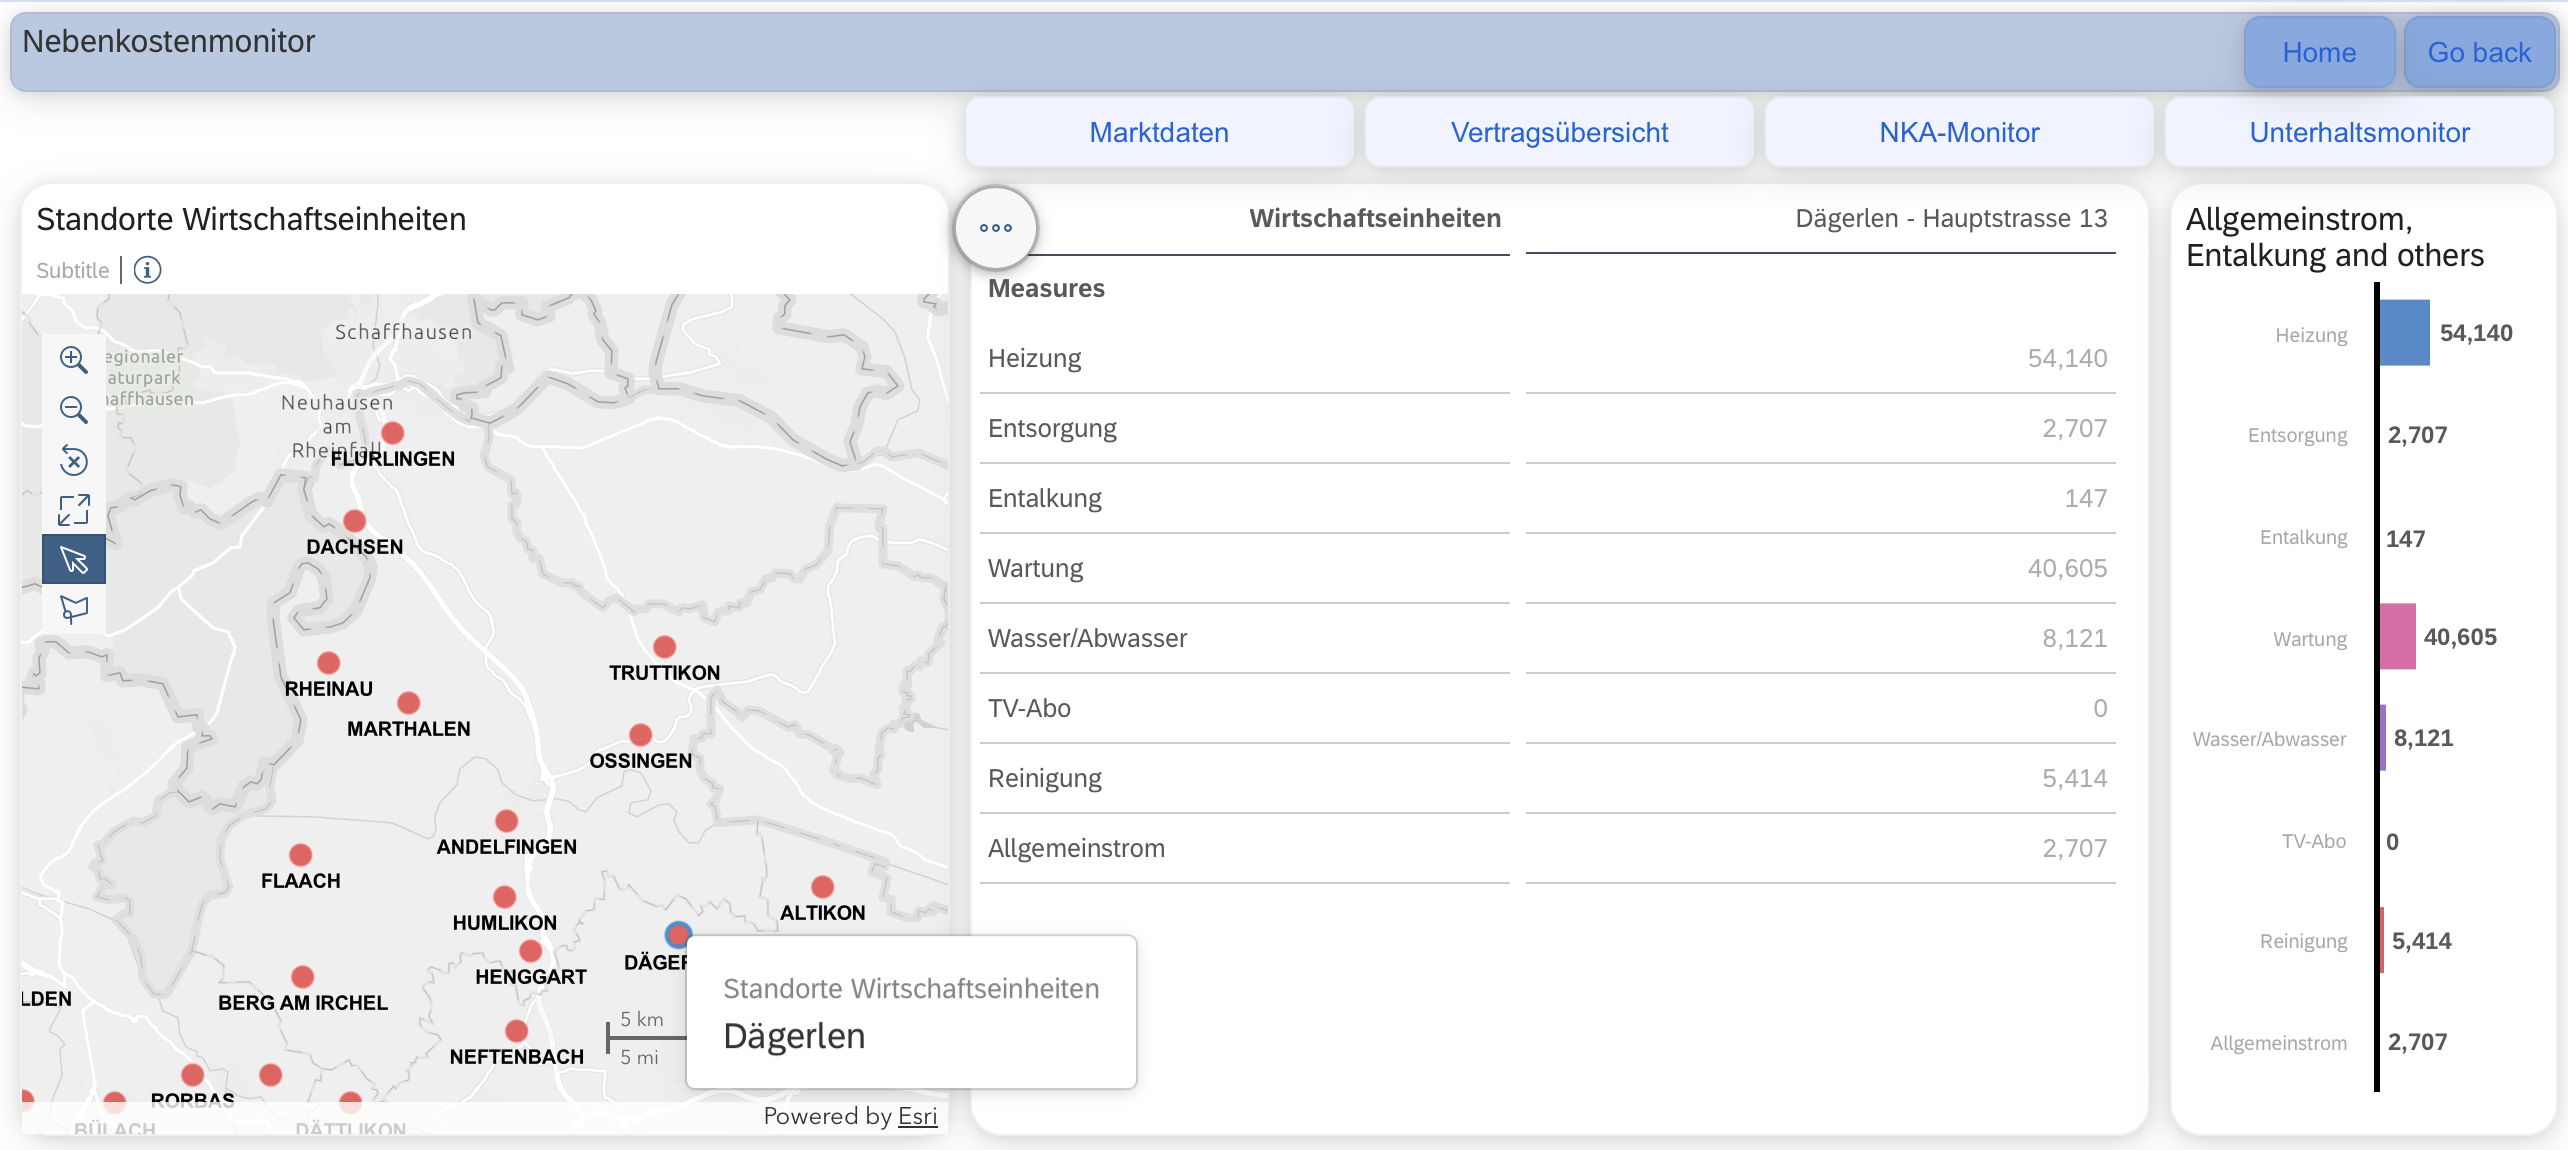
Stop discovering cost overruns at period-end.
Monitor ancillary costs, “Nebenkosten”, and operating expenses across the portfolio. Compare actuals against budget and prior periods, by building, cost category, or business entity, before the numbers become a problem in a board meeting.
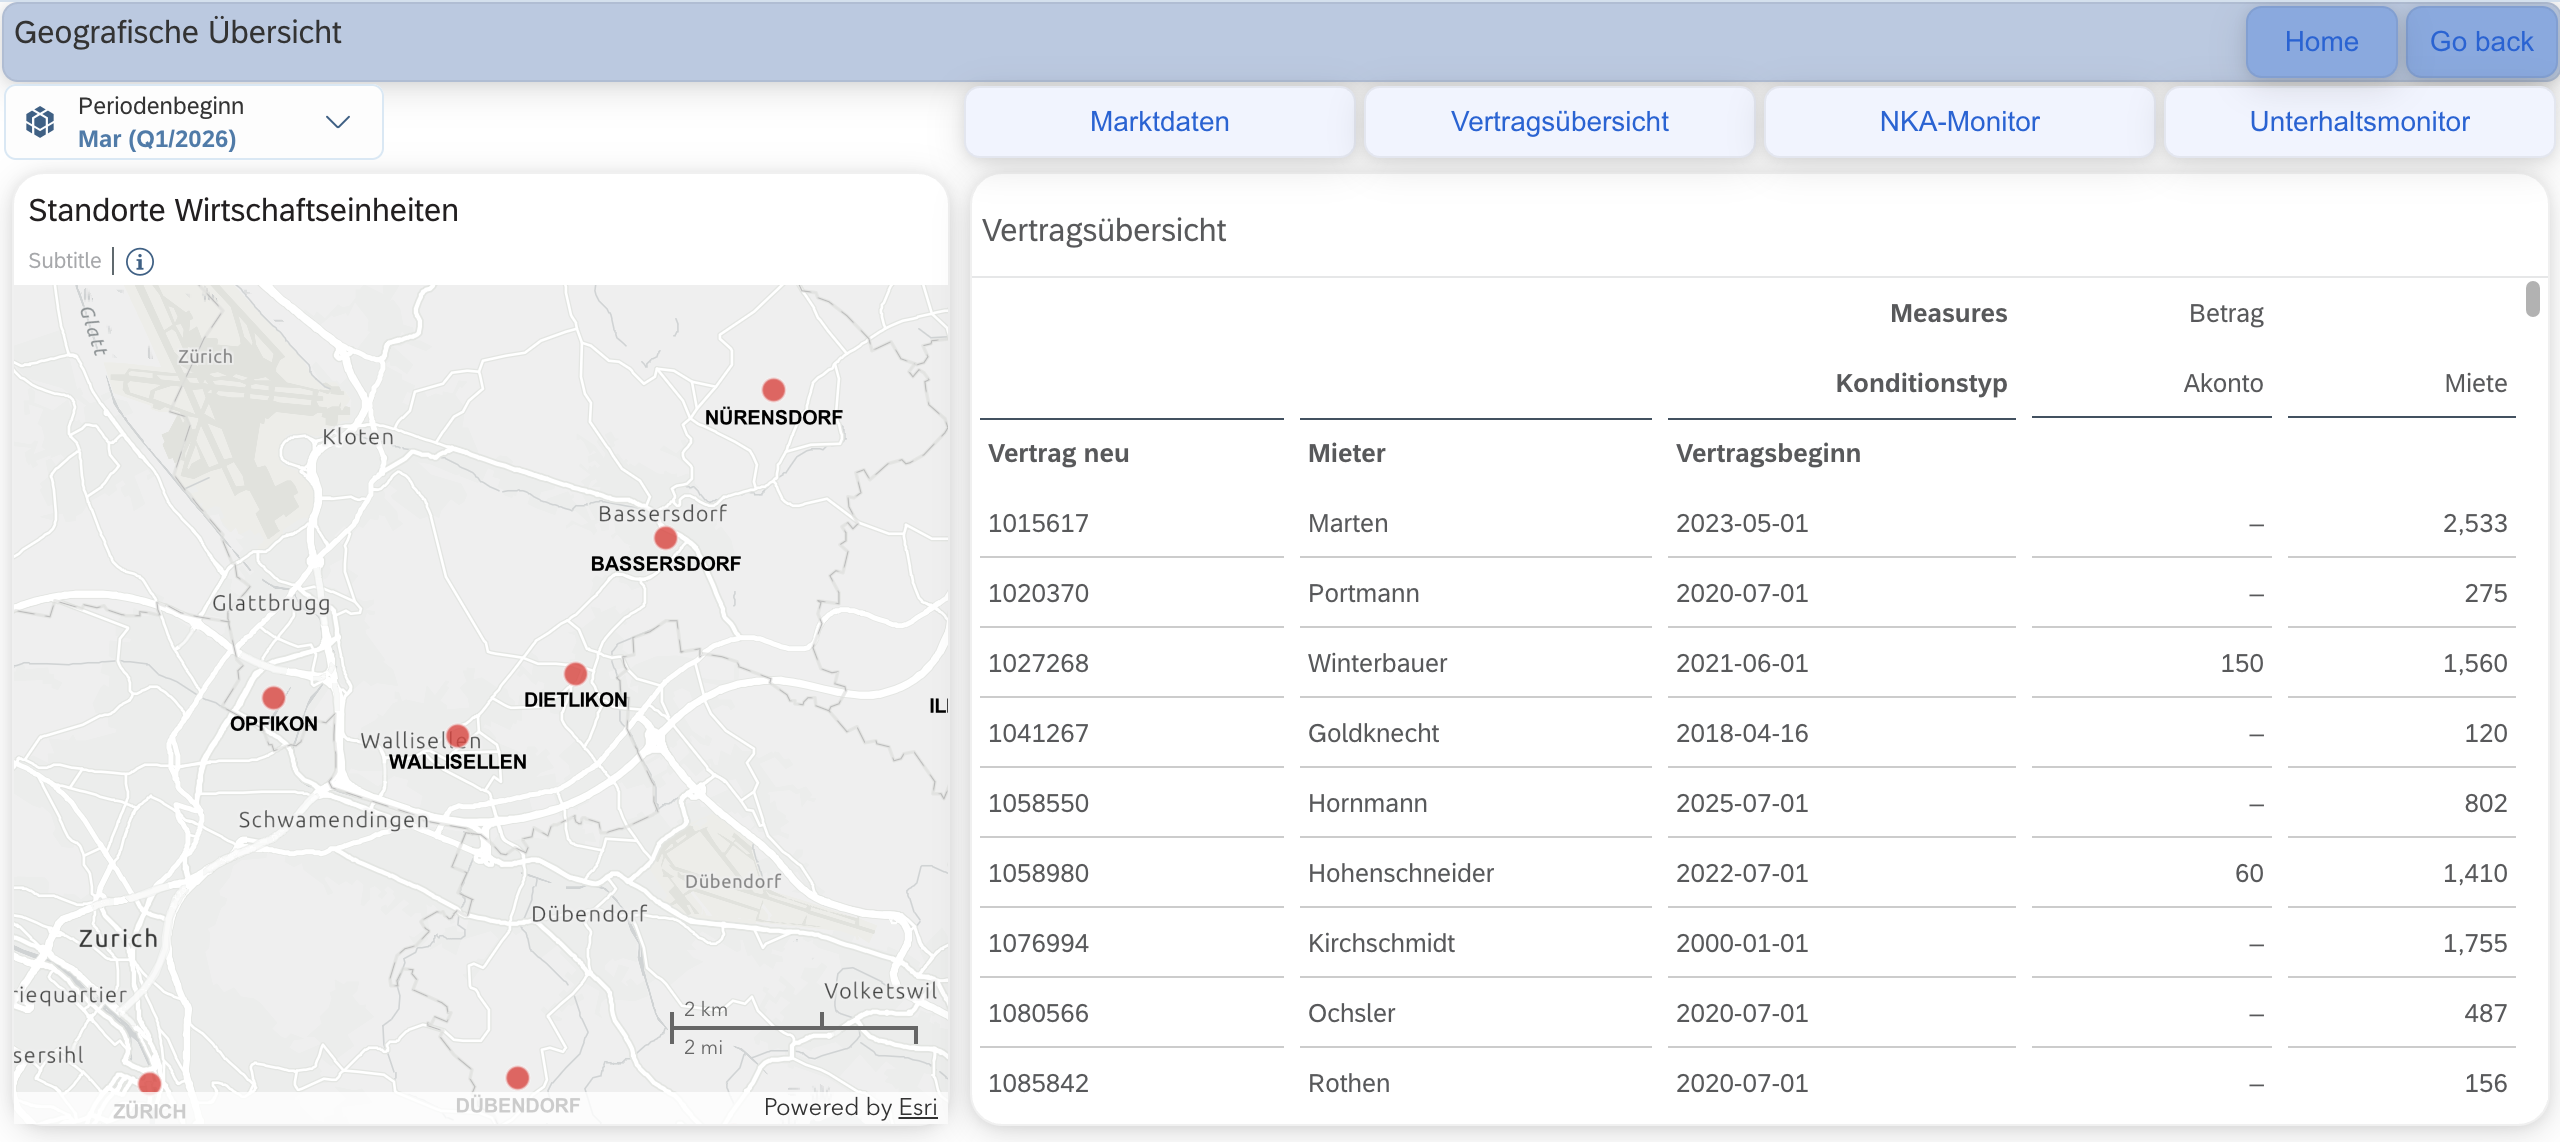
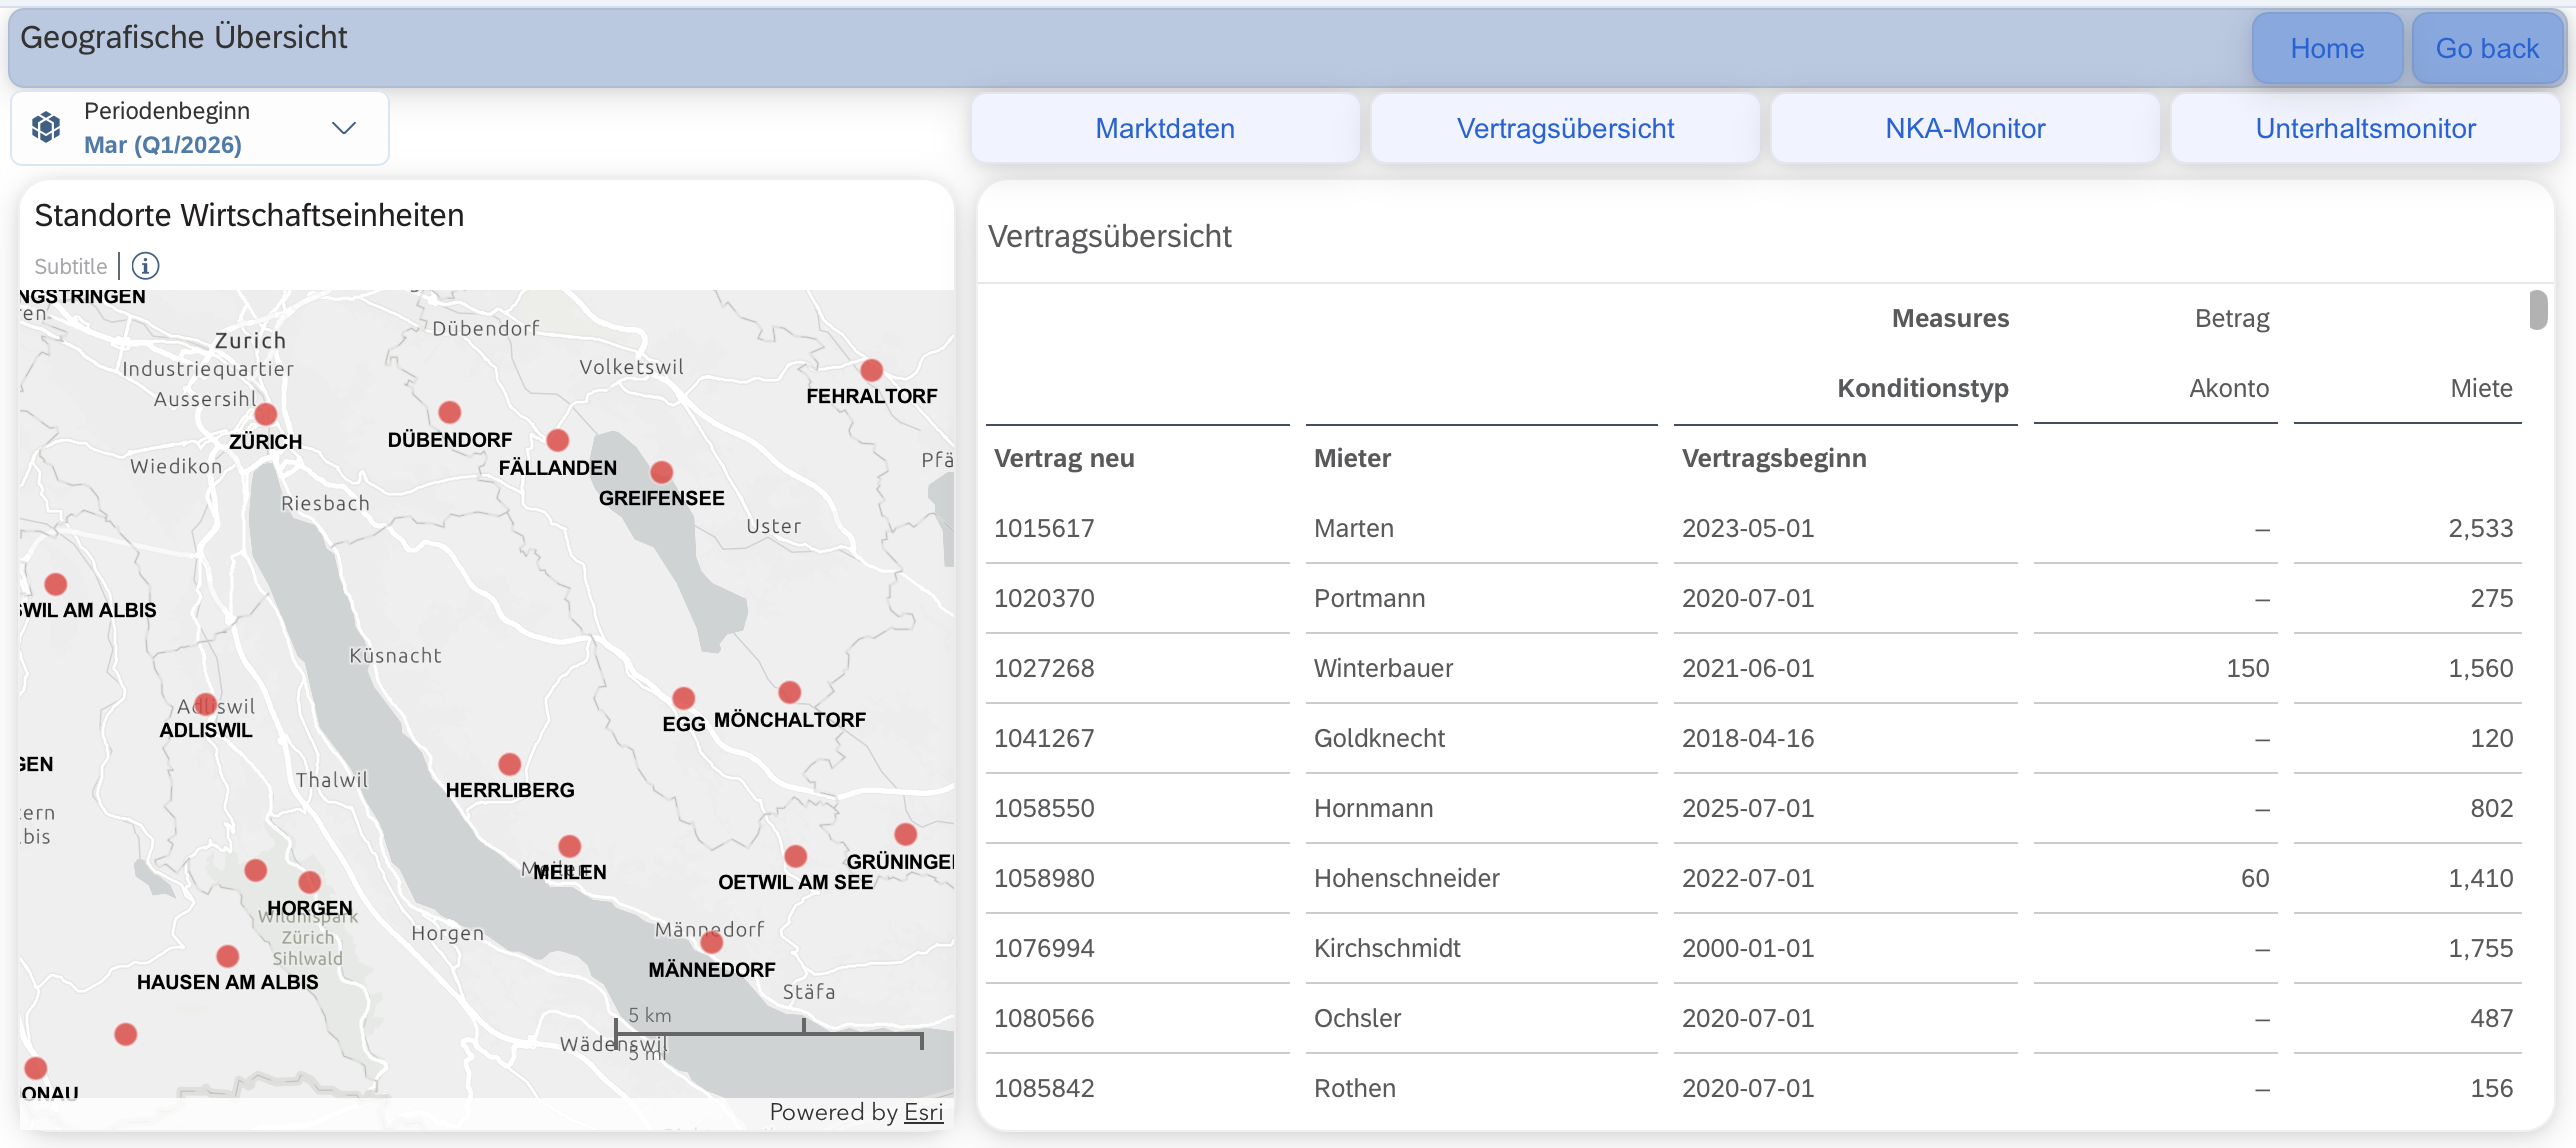
See your entire portfolio on one map. Drill into any asset instantly.
Every property plotted geographically with vacancy, income, and performance data visible at a glance. Click any asset to drill through to contracts, costs, and KPIs. The spatial view your board has been asking for built on the data you already have in SAP.
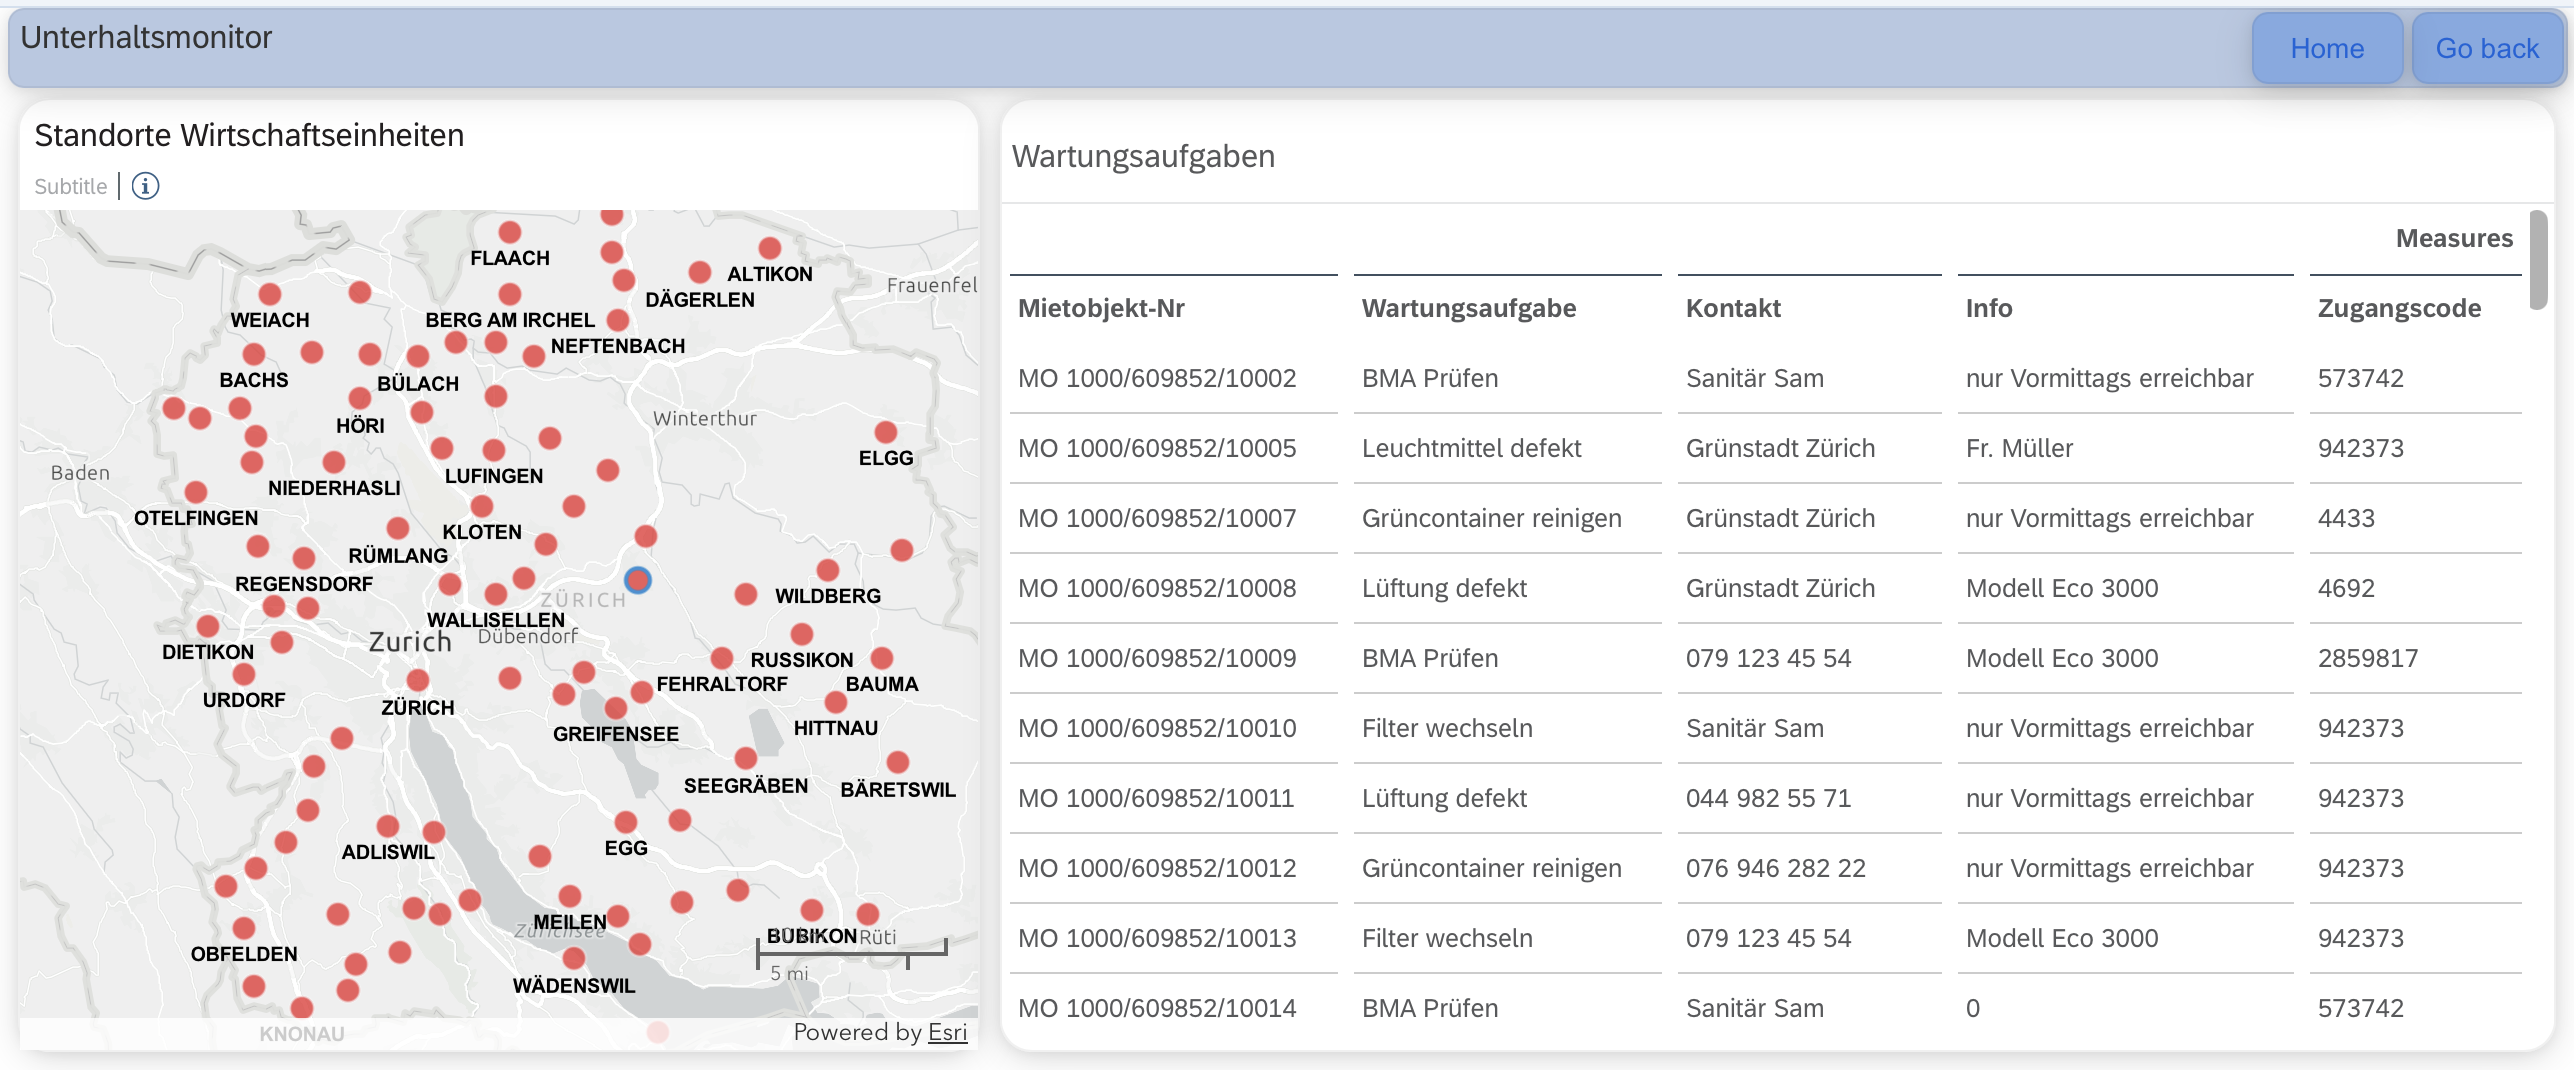
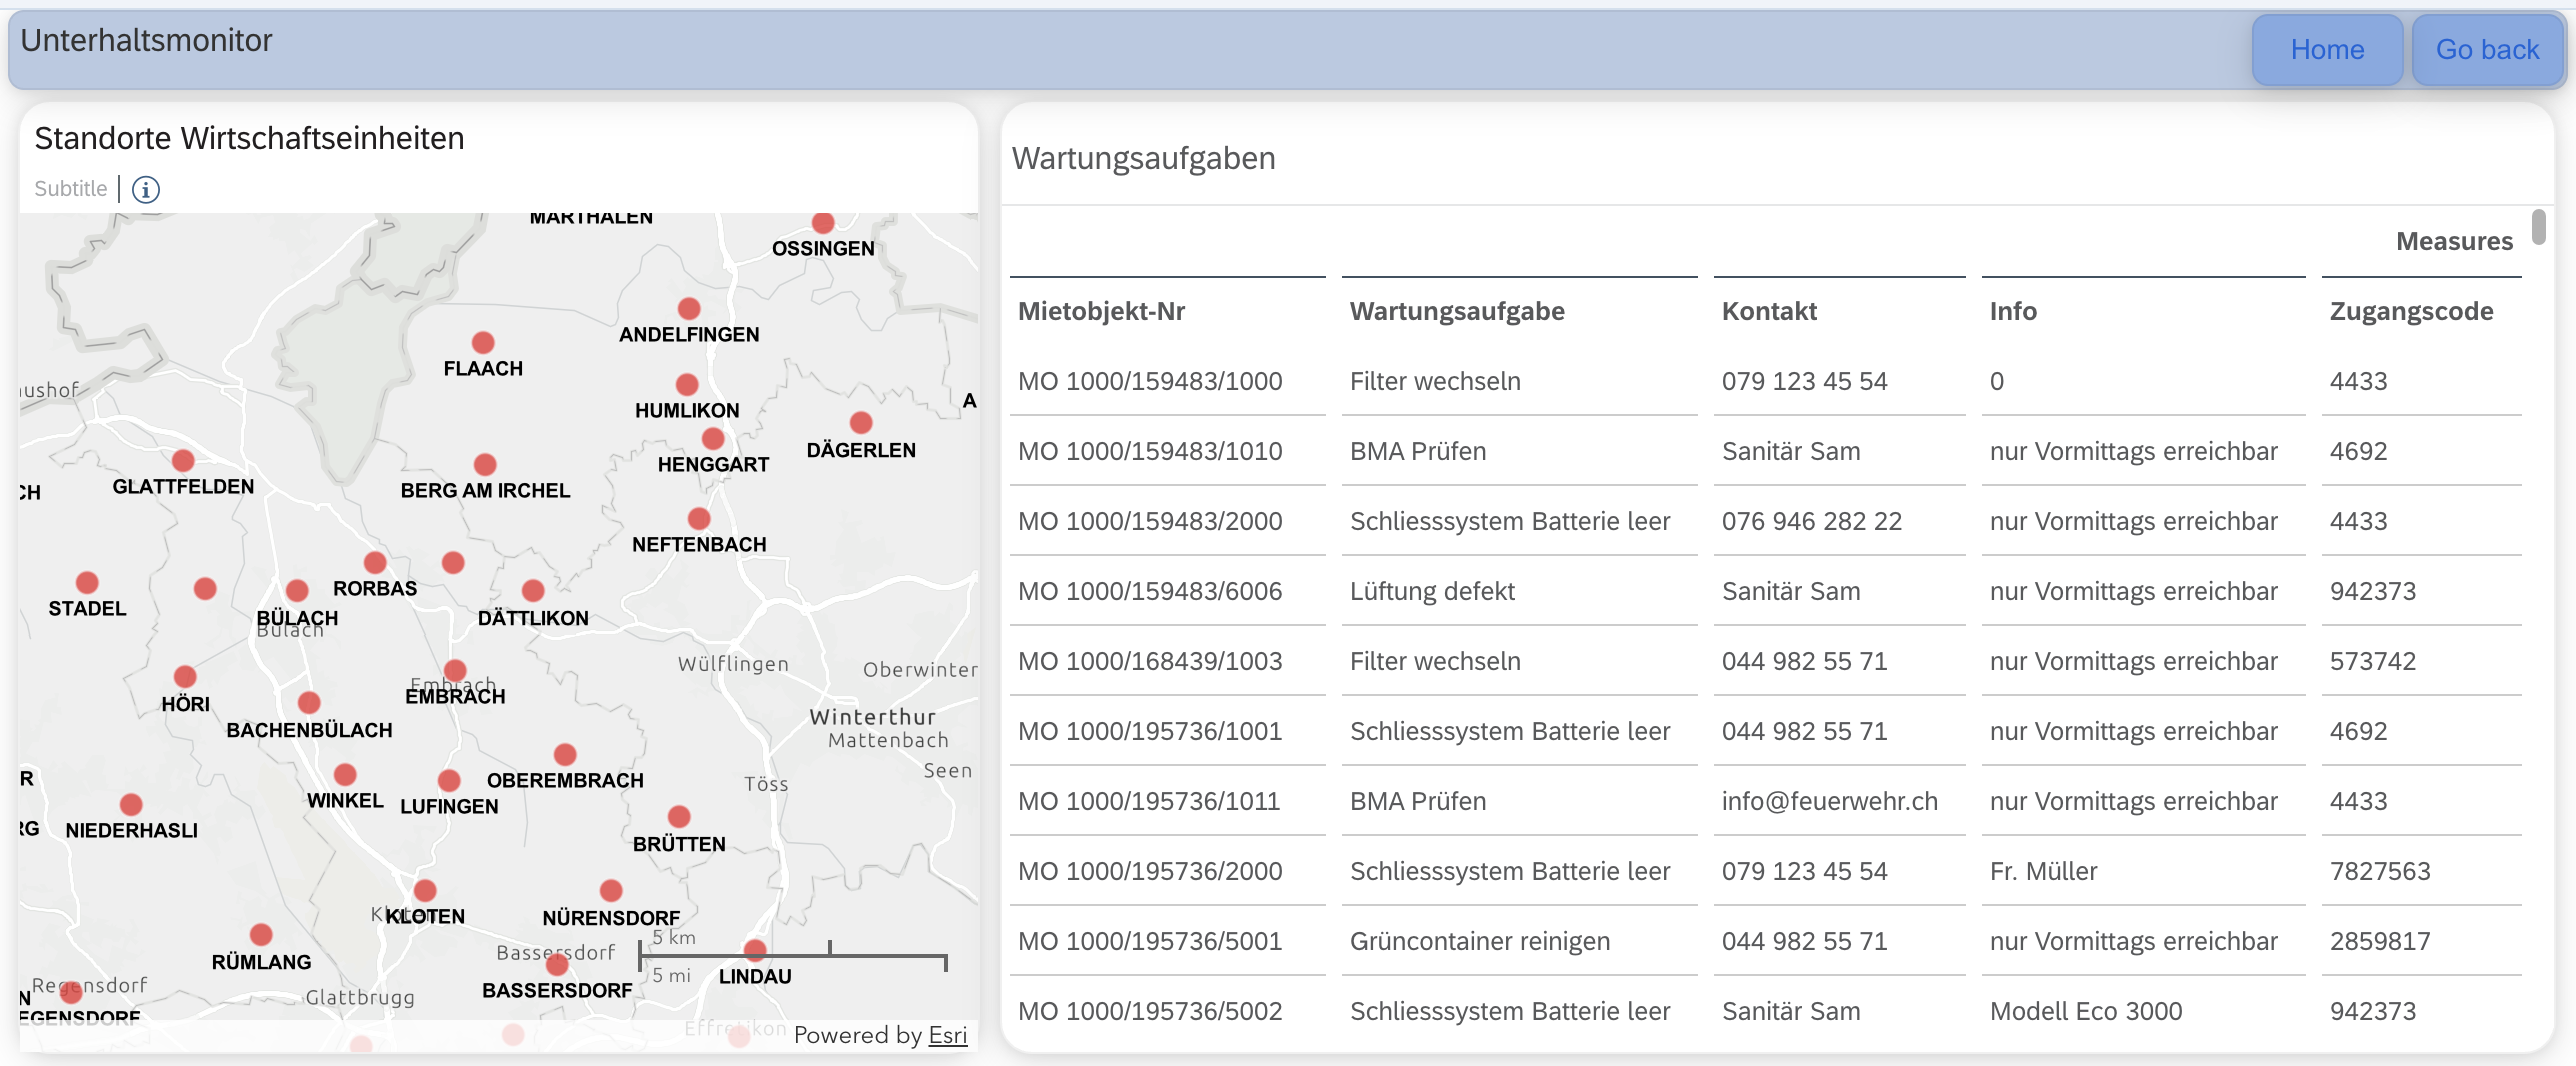
Stop managing your buildings from a spreadsheet on a job site.
Monitor and dispatch maintenance activities across the portfolio, from reactive repairs to planned inspections, with live status updates feeding directly back into SAP RE-FX. Equip field teams with mobile-ready task views and close the loop between on-site execution and system-of-record posting without manual re-entry.
Take your business to the next level
Discover innovative ways to seamlessly integrate new technologies into your administration. Your data holds far more potential than you currently perceive.
Real estate reporting is often still too manual, even when the data already exists in SAP
Many real estate teams already have valuable data in SAP RE-FX, S/4HANA, BW, Excel, and external systems. But management reporting is still often assembled manually at period-end: exports, reconciliations, static files, and dashboard views that are difficult to update or trust.
In Switzerland, these challenges compound quickly. Reference interest rate mechanisms, IFRS 16 lease accounting, multi-language board reporting, and cantonal requirements all add layers to an already manual process. SAP contains the data, turning it into reliable management insight requires the right reporting layer on top.
Outdated UI and bad usability
The SAP RE-FX UI is still at the R/3 level, and its user-friendliness leaves much to be desired. Modern tools enable a high-performance and intuitive user experience. Use dashboards, time series, interactive stories, and predictive simulations instead of outdated ALV table views.
Difficult drill-down from board view to asset or contract level
Individual reports of objecst exist in SAP, but a consolidated view across the full portfolio, by region, business entity, or business unit, usually requires custom manual work outside the system or custom developments.
Slow period-end reporting
By the time reports reach management, the data is often one to two weeks stale. Decisions about a live portfolio are being made on a snapshot that no longer reflects reality.
Too much Excel dependency
Excel is flexible, but as a reporting layer it introduces version risk, formula errors, and no audit trail. In a regulated or governance-sensitive environment, that exposure adds up fast.
Manual consolidation from multiple data sources
Period-end typically means pulling exports from SAP RE-FX, BW, and Excel, then reconciling manually across sources. The process is slow, prone to error, and nearly impossible to repeat with confidence.
Hard to connect financial, operational, and ESG indicators
Financial data lives in FI. Lease data is in RE-FX. ESG data sits in spreadsheets. Connecting them into a single management view means significant manual effort, every single month.
The same data. A completely different conversation.
The dashboard on the right does not come from a separate system. It comes directly from your SAP RE-FX, the same source your team already maintains. Instead of navigating transactions, management sees portfolio performance, vacancy, and income at a glance. No exports. No reconciliation. No waiting until period-end.
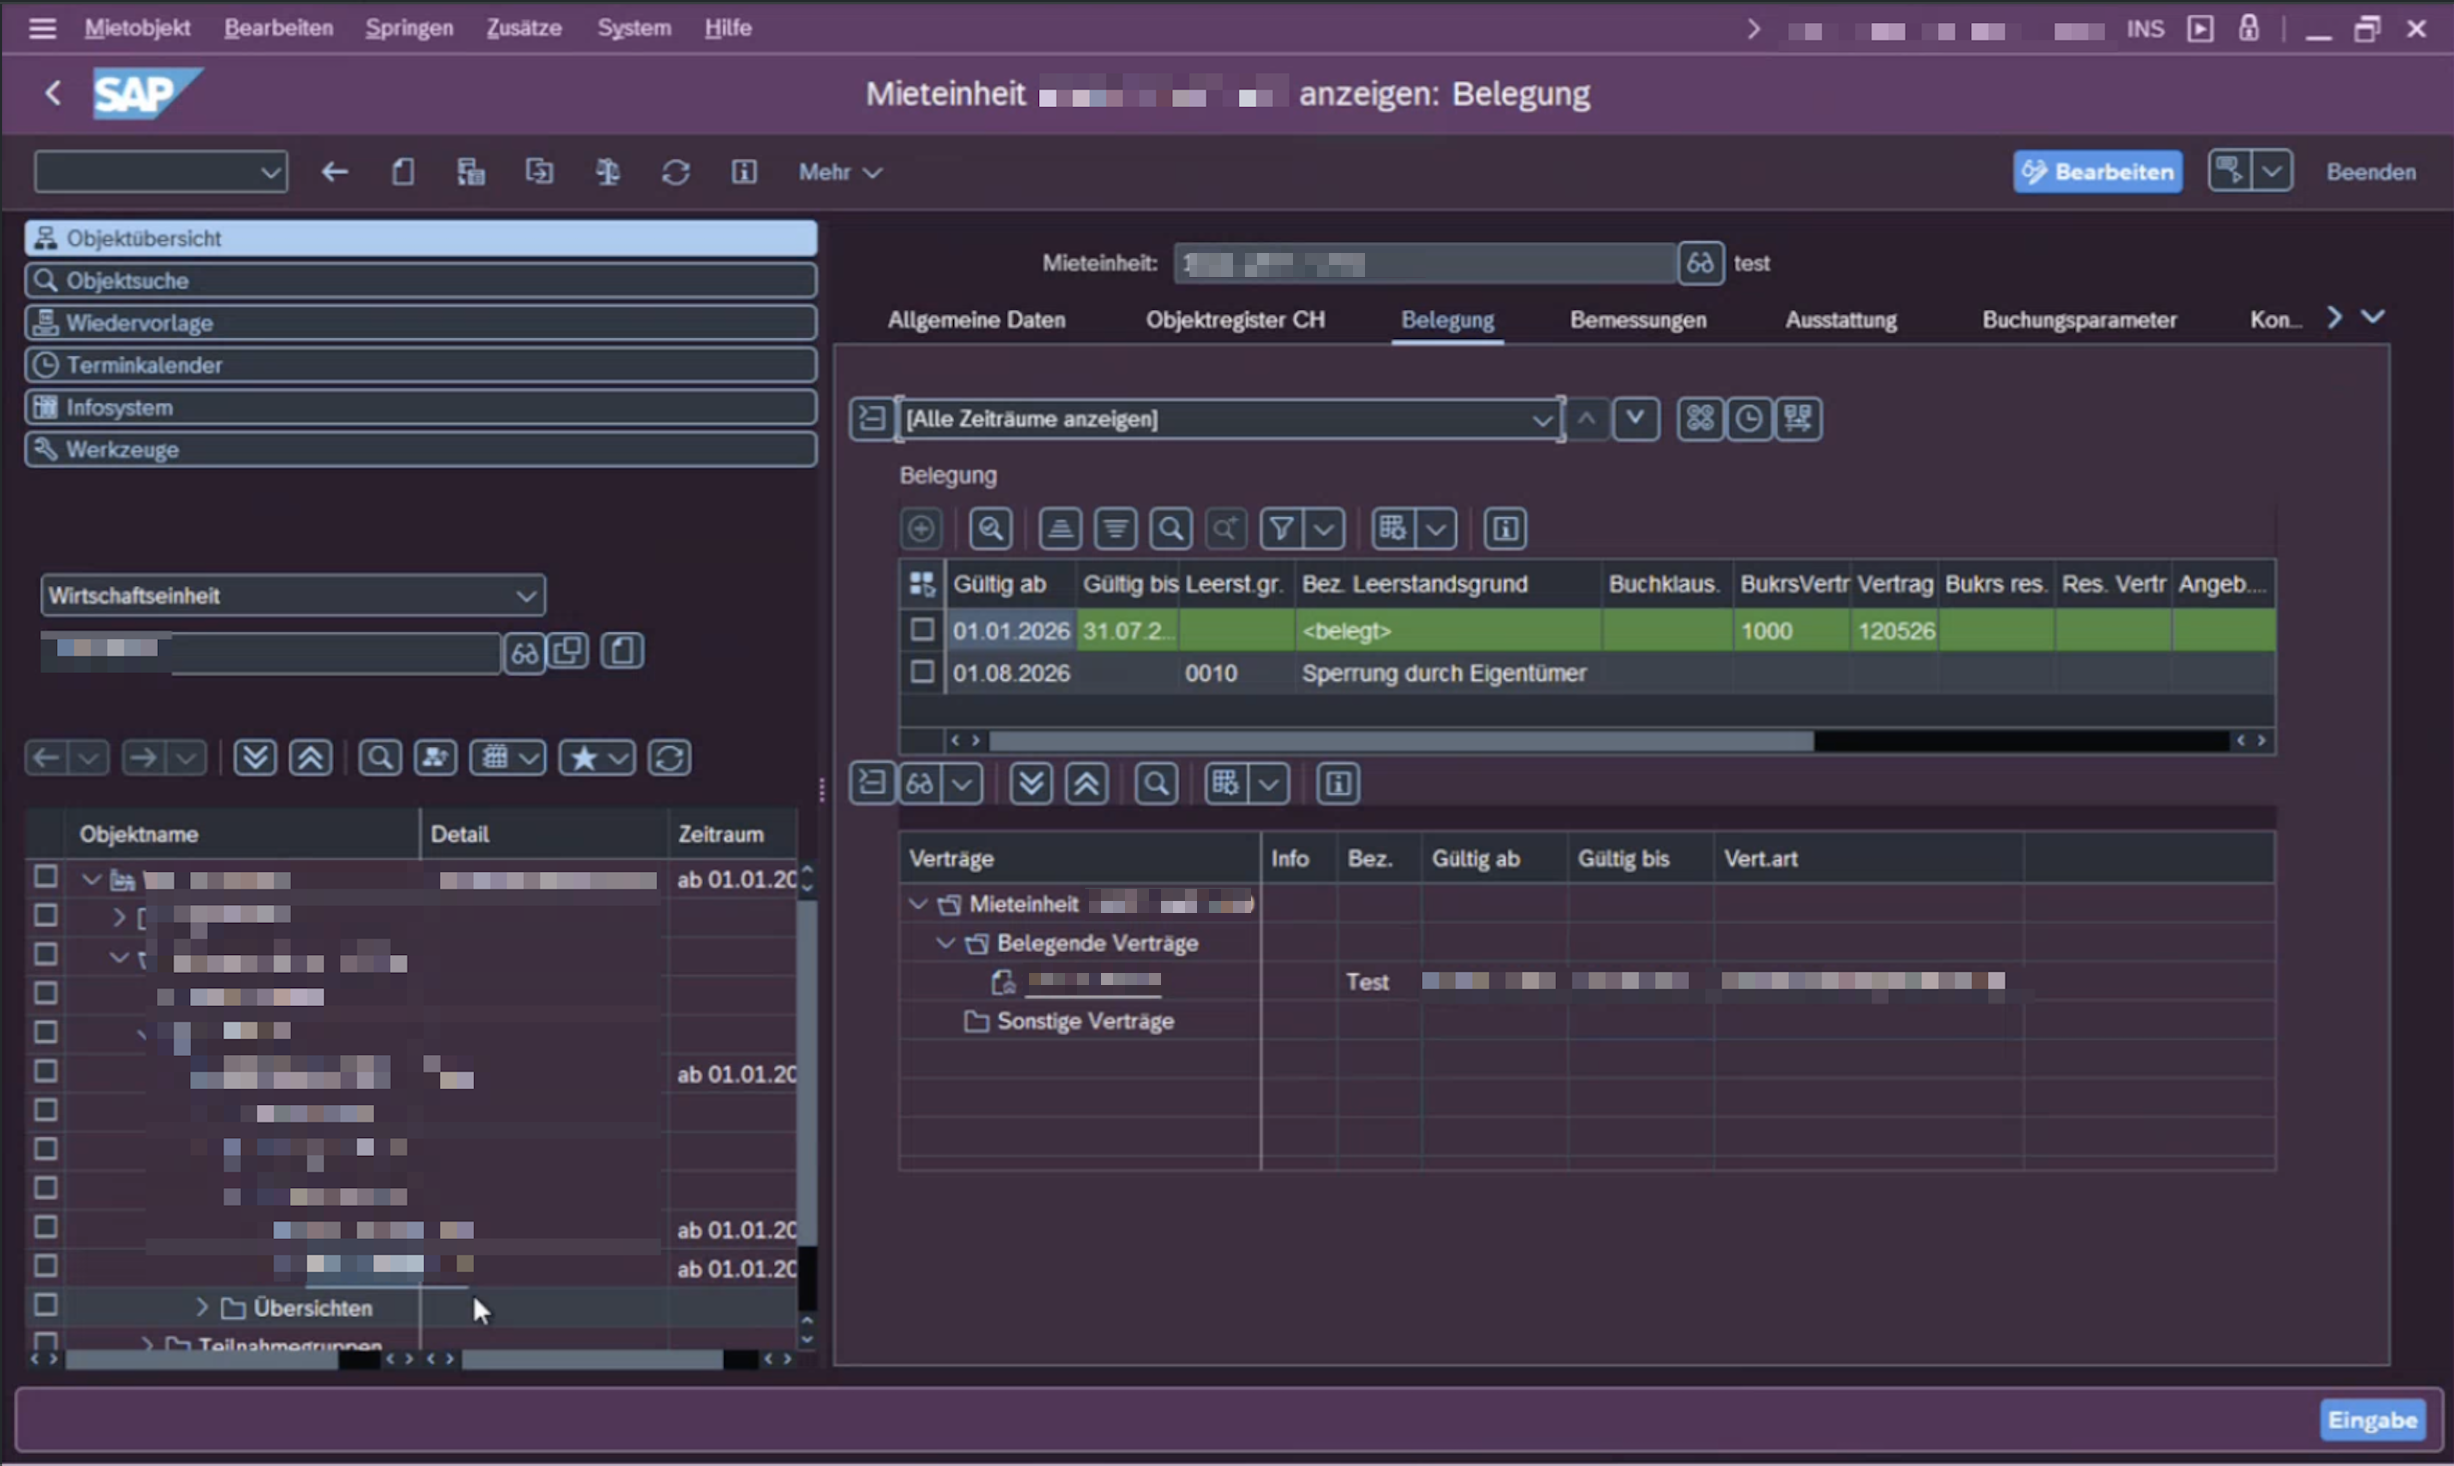
Before: navigating SAP transactions to find each data point
After: live portfolio dashboard — built on the same SAP RE-FX data

From Manual-Quarterly to Daily-Automated Portfolio Reporting at FZAG
In a real estate portfolio dashboard project for FZAG, Conactive helped replace manually consolidated, static reporting with an automated SAP Analytics Cloud dashboard. The result was a more accurate, effortless, and up-to-date overview of the real estate portfolio.
The previous process manually pulled data from multiple sources into a static monthly file, time-intensive, error-prone, and hard to update or trust. Conactive replaced it with a direct SAP Analytics Cloud connection to the source data, giving FZAG near-live portfolio visibility without the manual overhead.
Static monthly file → Live portfolio dashboard
Manual consolidation → Automatic data connection
Error-prone exports → Trusted, governed reporting
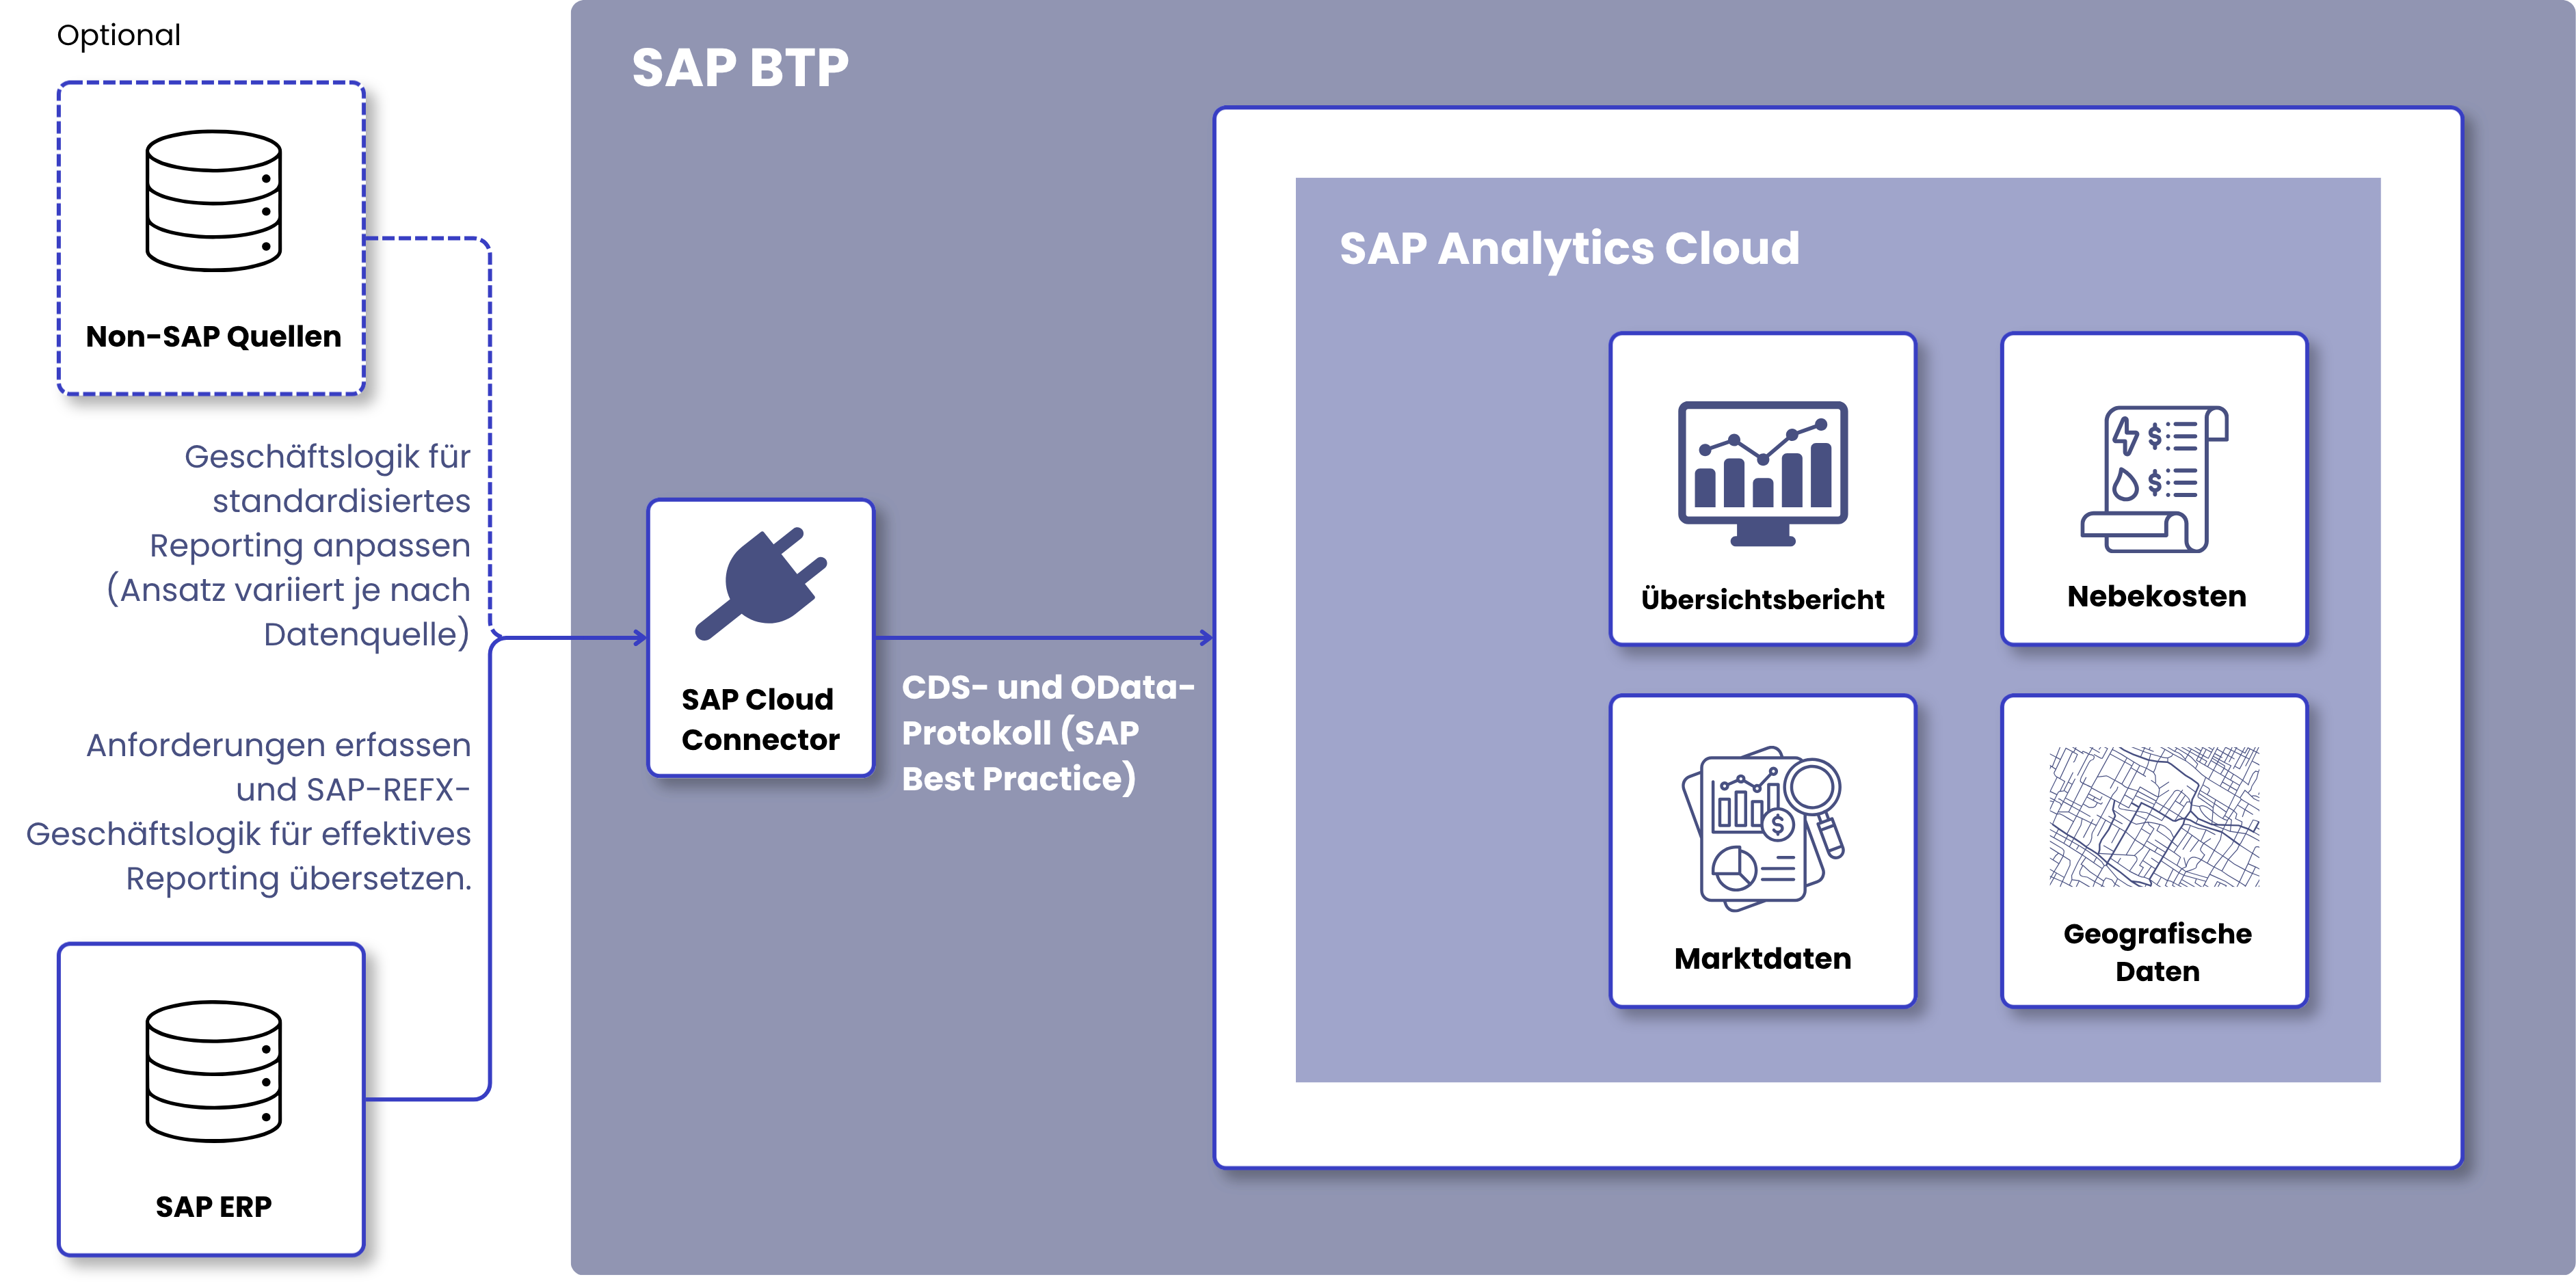
Designed for SAP-centered real estate landscapes
The reporting layer connects to your existing SAP stack, RE-FX, S/4HANA, BW/Datasphere, and SAC. No new data entry, no system replacement. If your organisation already runs SAP for real estate, the foundation is already in place.
Say goodbye to band-aid solutions in the SAP backend and build a future-proof solution that adheres to the Clean Core architecture.
Where needed, the architecture extends to Microsoft Azure for external data integration, and to Excel or third-party sources for market data, ESG indicators, or planning inputs. The result is a governed, scalable reporting layer that finance, real estate, and controlling teams can all rely on.
Conformity with Clean Core Principles
SAP RE-FX · S/4HANA · BW / Datasphere
SAP Analytics Cloud · SAP BTP
Azure · Excel · ESG & External Data
Built for Swiss real estate and SAP reporting requirements
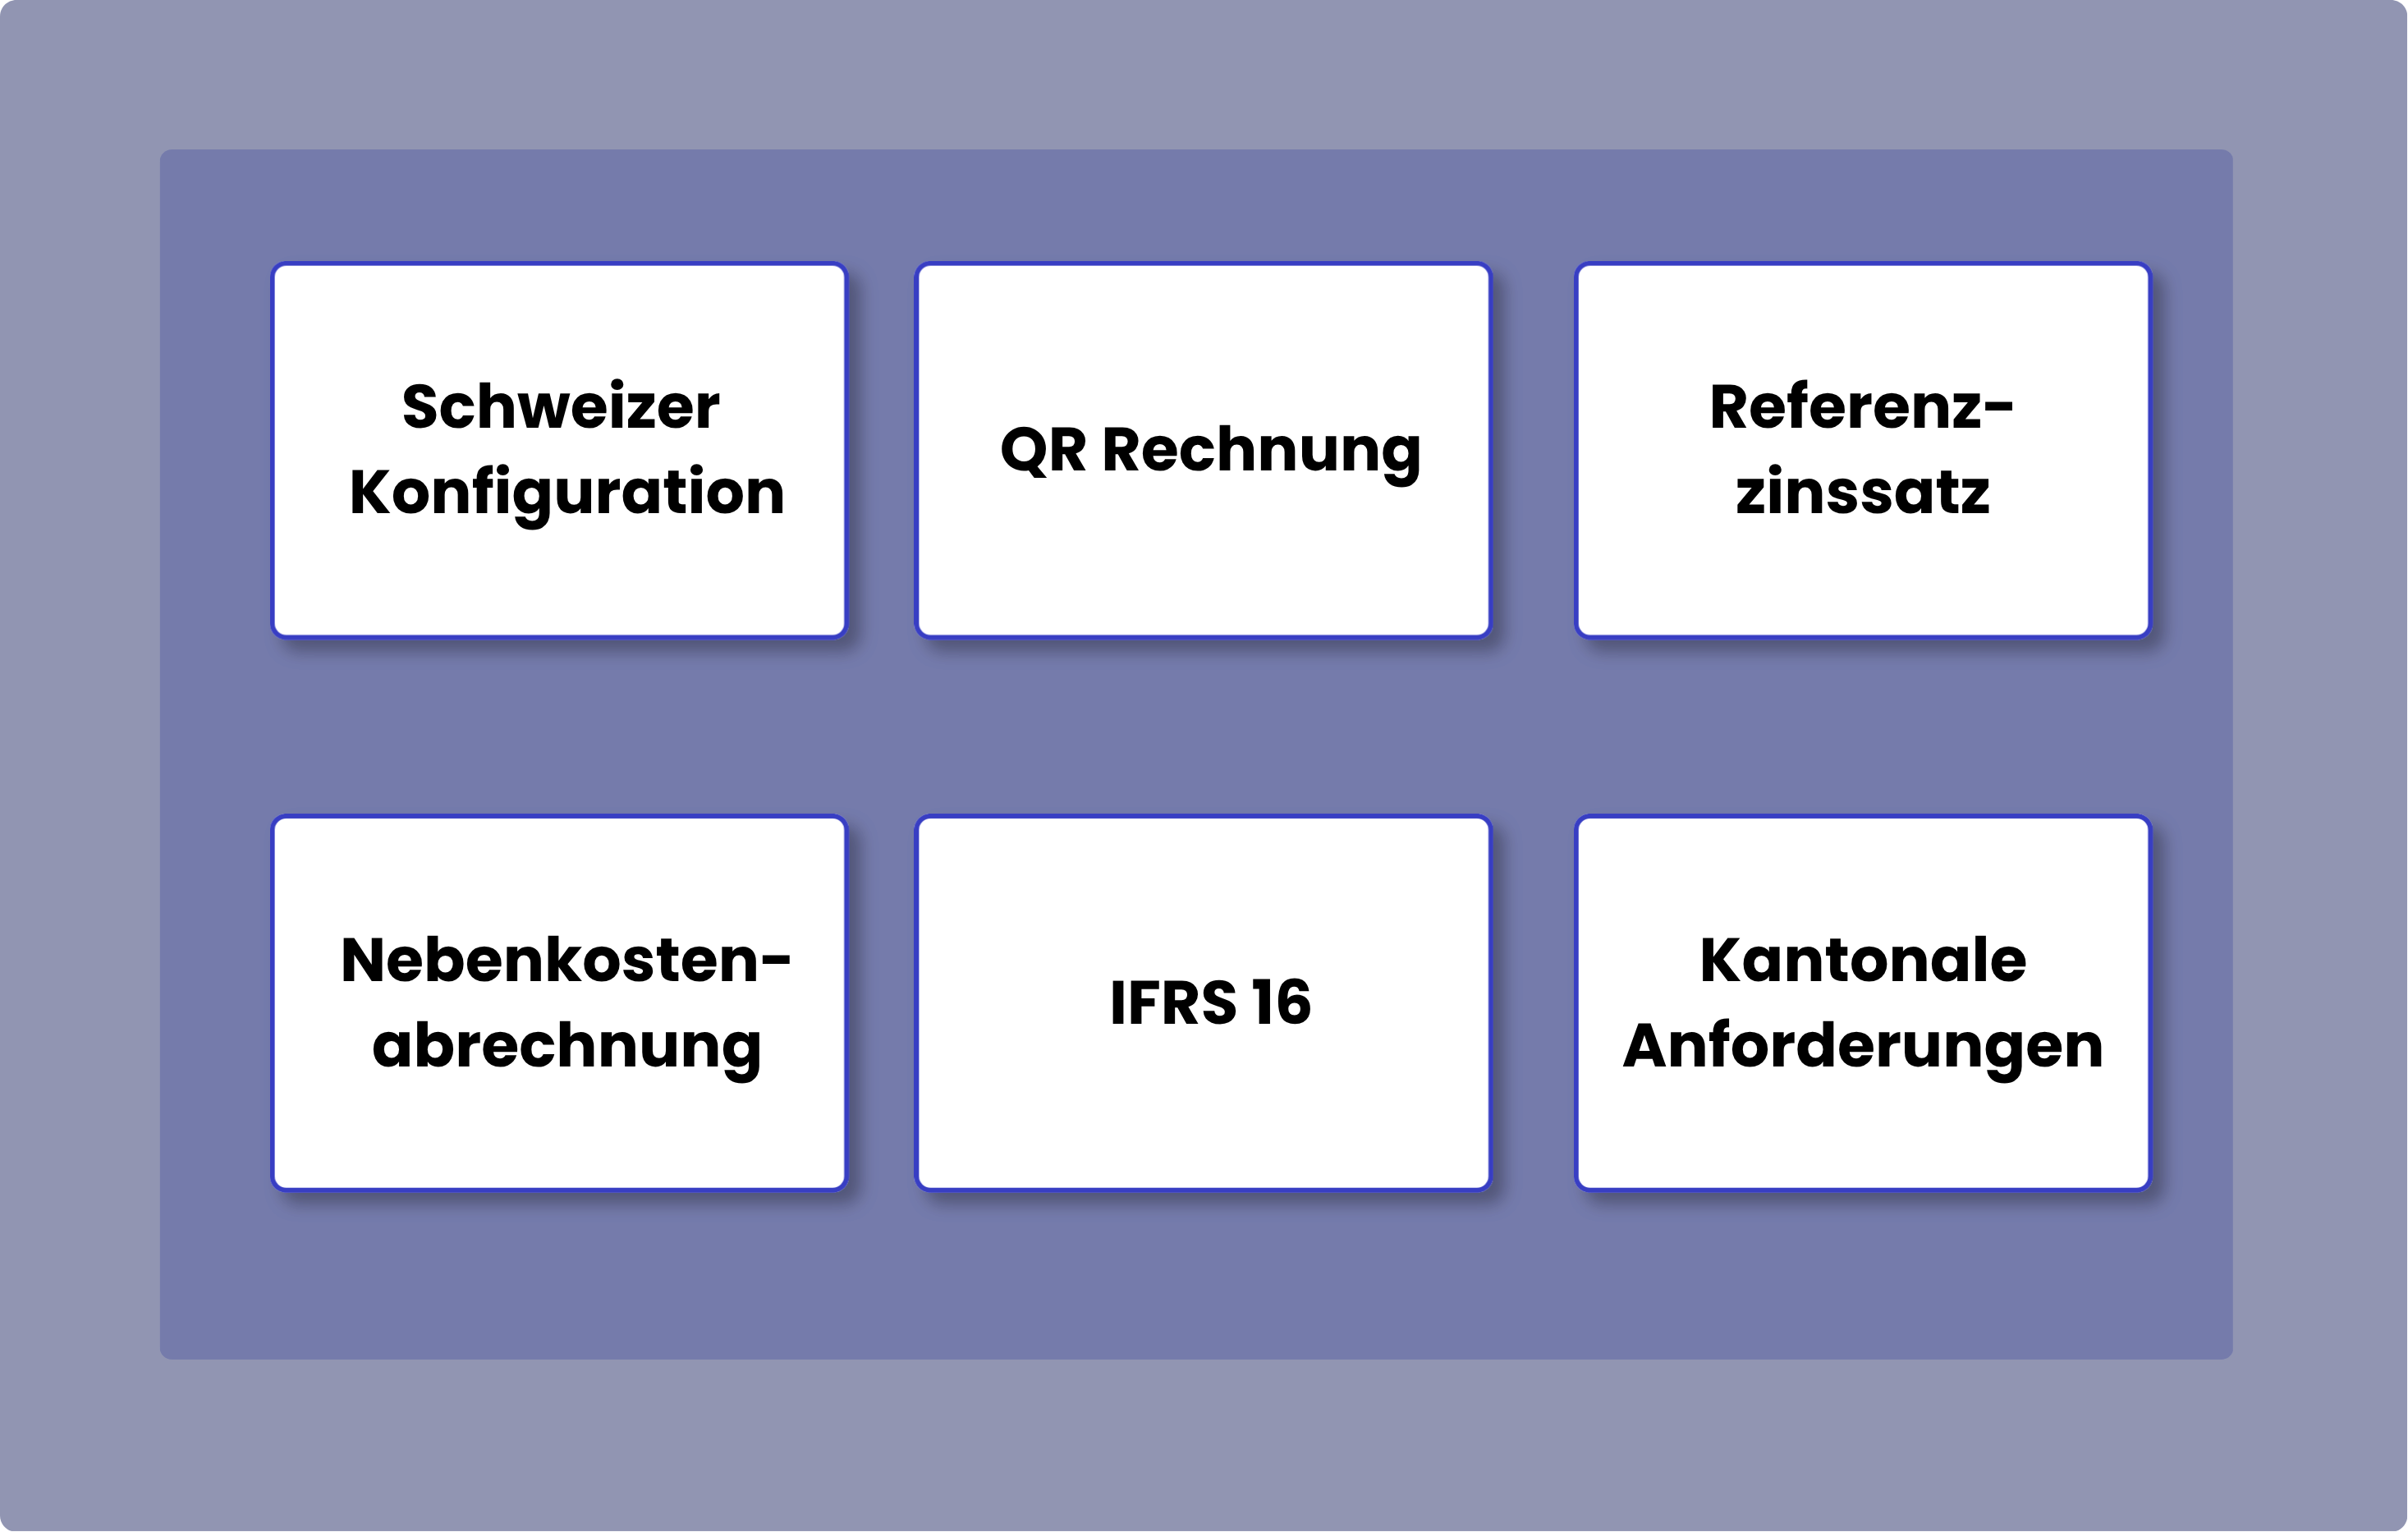
Conactive has been implementing and optimising SAP RE-FX for Swiss organisations since 1997. We understand not just the technology, but the Swiss-specific requirements that make real estate reporting genuinely complex: reference interest rate mechanisms, cantonal rules, IFRS 16 lease accounting, QR invoice integration, and multi-language reporting for German and English-speaking stakeholders.
That depth of Swiss SAP knowledge is what separates a credible dashboard from a beautiful one that breaks on first contact with your data. We build reporting that works with your actual RE-FX configuration, not a generic template mapped onto it.
Who this is for
This page is for SAP-driven Swiss organisations where real estate reporting is still too slow, too manual, or too disconnected from management decisions. If one of these roles sounds like you or your buying committee, you are in the right place.
Reporting & Finance
You need reporting your board trusts on the first read. Faster close cycles, consistent definitions of income and cost, profitability visible by asset and a clear line from actuals to budget without another Excel reconciliation.
Portfolio & Asset Management
You manage a portfolio but your reporting lags behind it. You want vacancy, income, and asset performance in one view, not assembled from three sources the night before a board meeting. And when a specific property comes up, you need to drill down without calling IT.
Finance & Controlling
Period-end is your bottleneck. You spend more time consolidating data than analysing it. You want a single governed data model where KPIs mean the same thing to everyone, and where the numbers in the management report match what is in SAP.
SAP, IT & Data
You maintain a complex SAP landscape and you are tired of ad-hoc Excel requests from the business. You want a clean, scalable reporting architecture on SAP Analytics Cloud that reduces the workarounds, not one that adds new ones.You are managing an IT landscape in a Clean Core-compliant environment.
Three reasons companies choose us
In a short call, we review your current real estate reporting
setup and identify where SAP Analytics Cloud could improve
transparency, automation, and management reporting.
Understand your current reporting landscape
SAP RE-FX, S/4HANA, Excel, BW, SAC, Azure, or other systems.
Learn more →Identify reporting pain points
Manual effort, data quality, portfolio visibility, ESG, budget vs actuals, or board reporting.
Learn more →Show relevant dashboard patterns
We map your situation to the real estate reporting showcase and suggest possible next steps.
Learn more →Become a forerunner
No preparation needed. No slides to review in advance. Just bring your current reporting setup and 60 minutes. Here is how we spend the time.
Map your SAP reporting landscape
We start by understanding what you currently have, RE-FX, S/4HANA, BW, Excel, or a mix. We ask about your reporting cadence, who uses it, and what period-end actually looks like for your team.
Surface the reporting gaps that cost you most
We identify where time is being lost, where data is untrusted, and which management questions your current reporting cannot answer. Vacancy, ESG, CAPEX, board packs, we know exactly where to look.
Show what’s already possible with your SAP data
We walk you through the SAC real estate dashboard showcase and map specific modules to your situation. You leave with a clear picture of what a first reporting improvement looks like, and a realistic sense of what it takes.
Ready to stop fighting your SAP and start using it?
Book a free 45-minute discovery call. No sales pitch, no obligation, just an honest conversation about your SAP situation and whether we’re the right fit to help.
Contact us
Schedule a Call
Let's talk! Get in touch with our experts!
Free Discovery CallLocation
Switzerland
conactive AG
Blegistrasse 15
6340 Baar
Send a Message
Do you have questions?